
Fusion’s answer to the classic daily summary report used within Impact. Provides a summary overview of all trading performed during the selected dates. This report is split into multiple sections and although it allows reporting over a wide date range, it is typically used at the end of each service day to provide an overview of the day’s trading.
Criteria
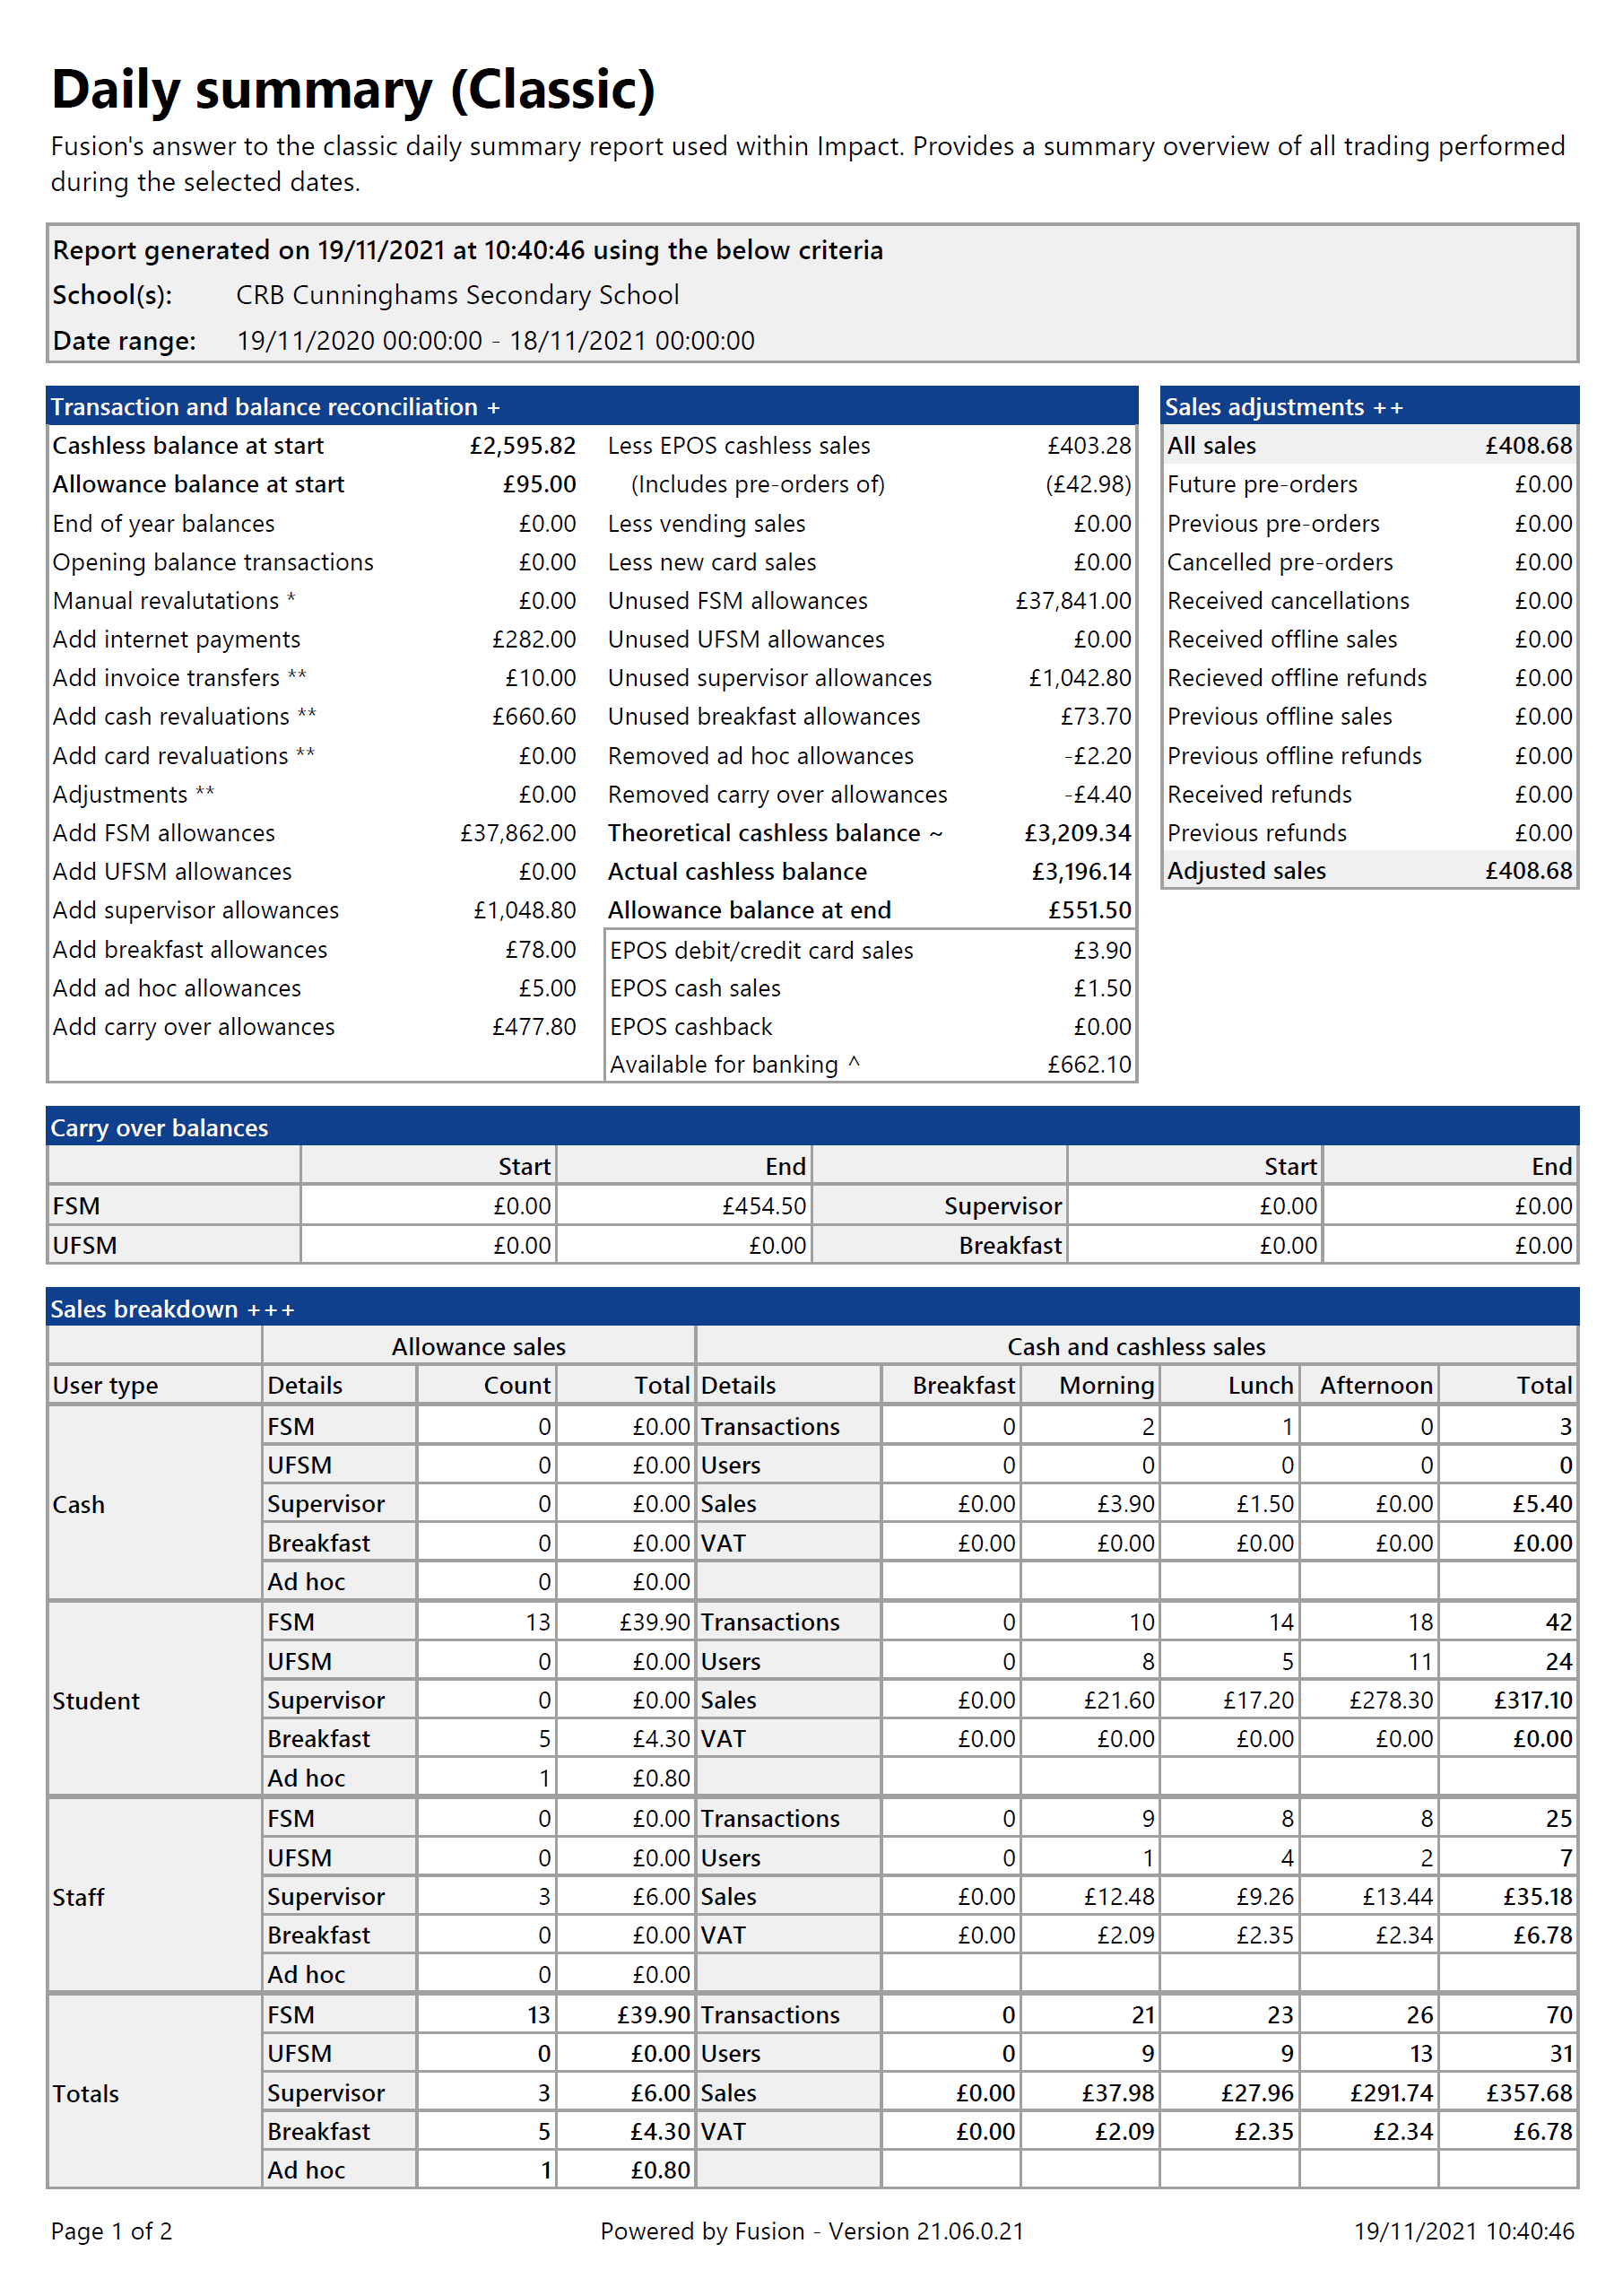
- Date range
- Timeframe: Choose from a selection of defined date ranges such as ‘Last week’, ‘Previous year’, ‘Yesterday’. Defaults to ‘Today’.
- Start: Adjust the start date for the report (inclusive)
- Finish: Adjust the end date for the report (inclusive).
- Location
- School: Allows you to select the school to generate the data for (defaults to the currently selected school).
- Aggregate report: Used in conjunction with the school filter, when selecting more than one school, when ‘Aggregate report’ is enabled (default) all the data is aggregated and displayed on a single report. When the checkbox is unchecked, the system will generate a report for each selected school.
Transaction and balance reconciliation
This section provides information on how balances have changed during the reporting range.
Sales adjustments
This section provides information on transactions that were partially inside the selected date range. Each transaction has two date and time stamps. The first one is the date and time the transaction occurred, and the second is the date and time that the transaction was for. For Point of Sale transactions, these two timestamps will typically be the same, however, if the PoS was in offline mode, the date/time that the transaction occurred will differ from the date/time that the transaction is uploaded to the database.
Similarly for pre-orders, the order may be made on a Monday, however, the order is for Tuesday. So if viewing this report for Monday, the money would have left the users account when the order was placed, but will not be displayed in the Sales breakdown section of the report as this is showing sales for Monday.
Therefore, this section helps clarify any discrepancies between the ‘Less EPOS cashless sales’ value in the ‘Transaction and balance reconciliation’ section with the sales in the ‘Sales breakdown’ section.
Carry-over allowance balances (Only displayed if Carry-over enabled)
This section of the report is only visible if any of the allowance purses has carry-over enabled. Carry-over allows all or part of an unspent allowance to be rolled forward to be spent on future days. This section provides details as to how the carry-over allowances has changed during the selected date range.
Sales breakdown
Split by user type, this section provides a breakdown of sales. It has separate sections for allowance sales (on the left), and cash and cashless sales (on the right).
Key:
+ Manual revaluations is the sum of all physical cash that users have paid into the revaluation machines to top up their cashless accounts.
++ These values are top-ups that have been made via the Back office or the Point of Sale.
~ This figure is calculated by starting with the ‘Cashless balance at start’ figure, then adding all the values on the left (ignoring the ‘Allowance balance at start’ figure) and then taking away the figures on the right. This figure should then match the ‘Actual cashless balance’ figure. If not, this could indicate that there is a problem.
^ This figure is all of the physical cash entered by the system. It is calculated as follows: ‘Manual revaluations’ + ‘Add cash revaluations’ + ‘EPOS cash sales’ – ‘EPOS cashback’.
Post your comment on this topic.